Docker Compose
This repository contains utility scripts to deploy a docker telemetry stack.
Pre-requisites
Docker (installing Docker)
Docker Compose (installing Compose)
To guarantee a smooth deployment, the kernel headers must be installed in the host operating system.
This can usually be done on Debian-like distributions with:
apt-get -y install linux-headers-$(uname -r)
Or, on RHEL-like distributions:
yum -y install kernel-devel-$(uname -r)
Deploy SysFlow
Three deployment configurations are described below: local (collector-only), batch export mode, and stream export mode. The local deployment stores collected traces on the local filesystem and the full stack deployments export the collected traces to a S3-compatible object storage server or streams SysFlow records to remote syslog server or ELK (additional exporters can be implemented as plugins).
Setup
Clone this repository and change directory as follows:
git clone https://github.com/sysflow-telemetry/sf-deployments.git
cd sf-deployments/docker
Local collection probe only
This deployment will install the Sysflow collection probe only, i.e., without an exporter to an external data store (e.g., S3). See below for the deploytment of the full telemetry stack.
To start the telemetry probe (collector only):
docker-compose -f docker-compose.collector.yml up
Tip: add container.type!=host to
FILTERstring located in./config/.env.collectorto filter out host (non-containerized) events.
To stop the collection probe:
docker-compose -f docker-compose.collector.yml down
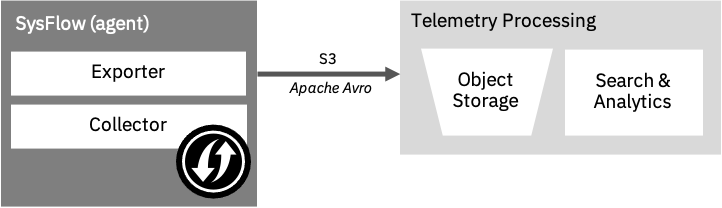
Batch export
This deployment configuration includes the SysFlow Collector and S3 Exporter.
First, create the docker secrets used to connect to the S3 object store:
echo "<s3 access key>" > ./secrets/access_key
echo "<s3 secret key>" > ./secrets/secret_key
Then, configure the S3 endpoint in the exporter settings (default values point to a local minio object store described below). Exporter configuration is located in ./config/.env.exporter. Collector settings can be changed in ./config/.env.collector. Additional settings can be configured directly in compose file.
To start the telemetry stack:
docker-compose -f docker-compose.exporter.yml up
To stop the telemetry stack:
docker-compose -f docker-compose.exporter.yml down
To start the telemetry stack with a local minio object store:
docker-compose -f docker-compose.minio.yml -f docker-compose.exporter.yml up
To stop the local minio instance and the telemetry stack:
docker-compose -f docker-compose.minio.yml -f docker-compose.exporter.yml down
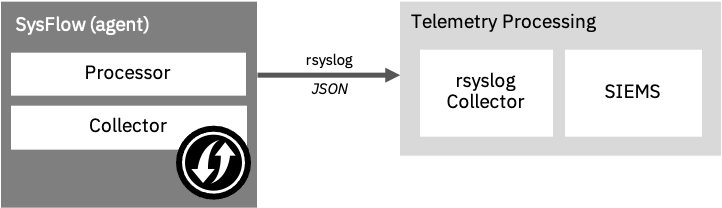
Stream processing
This deployment configuration includes the SysFlow Collector and Processor with rsyslog exporter. Alternatively, you can change the Processor configuration to stream events to ELK, or any other custom exporter plugin. Check the Processor’s exporter configuration for details on how to configure the exporter to stream events to other backends.
First, configure the rsyslog endpoint in the processor settings. Processor configuration is located in ./config/.env.processor. Collector settings can be changed in ./config/.env.collector. Additional settings can be configured directly in compose file.
To start the telemetry stack:
docker-compose -f docker-compose.processor.yml up
To stop the telemetry stack:
docker-compose -f docker-compose.processor.yml down
Sysflow trace inspection
Run sysprint and point it to a trace file. In the examples below, sysprint is an alias for:
docker run --rm -v /mnt/data:/mnt/data sysflowtelemetry/sysprint
Tabular output
sysprint /mnt/data/<trace name>
JSON output
sysprint -o json /mnt/data/<trace name>
CSV output
sysprint -o csv /mnt/data/<trace name>
Inspect traces exported to an object store
sysprint -i s3 -c <s3_endpoint> -a <s3_access_key> -s <s3_secret_key> <bucket_name>
Tip: see all options of the
sysprintutility with-hoption.
Inspect example traces
Sample trace files are provided in sf-collector/tests. Copy them into /mnt/data to inspect inside sysprint’s environment.
sysprint /mnt/data/tests/client-server/tcp-client-server.sf
Tip: other samples can be found in the tests directory
Analyzing collected traces
A Jupyter environment is also available for inspecting and implementing analytic notebooks on collected SysFlow data. It includes APIs for data manipulation using Pandas dataframes and a native query language (sfql) with macro support. To start it locally with example notebooks, run:
git clone https://github.com/sysflow-telemetry/sf-apis.git && cd sf-apis
docker run --rm -d --name sfnb -v $(pwd)/pynb:/home/jovyan/work -p 8888:8888 sysflowtelemetry/sfnb
Then, open a web browser and point it to http://localhost:8888 (alternatively, the remote server name or IP where the notebook is hosted). To obtain the notebook authentication token, run docker logs sfnb.